All tools run in your browser—no data leaves this page.
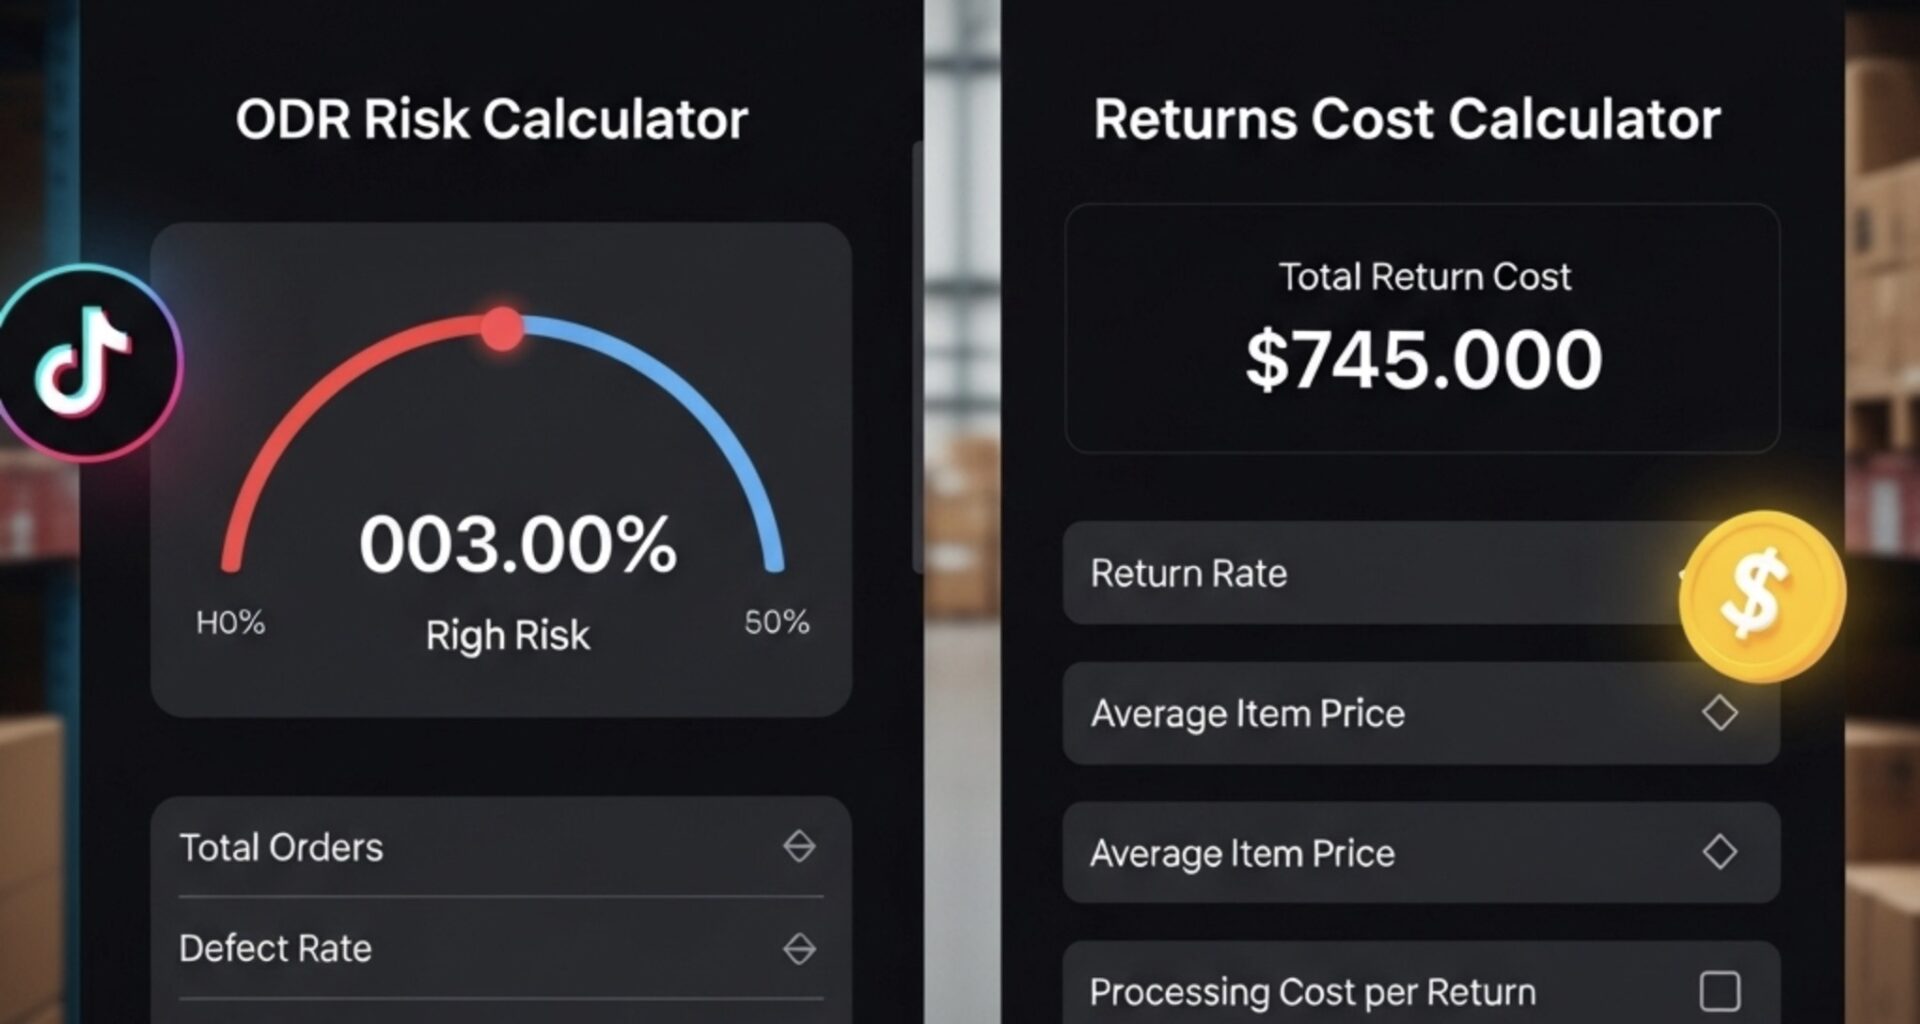
When your TikTok Shop starts humming, the conversation shifts from “how do we ship?” to “are we compliant and profitable?” These two calculators are designed for that problem–solution moment:
- On‑Time Ship & ODR Risk Forecaster – estimate your on‑time shipping rate, a blended ODR (order‑defect risk) score, and how automation could close the gap to your target.
- Returns Cost Calculator – quantify your monthly returns burden and see the savings/ROI from automating return labels, routing, and restocking.
1) On‑Time Ship & ODR Risk Forecaster
What it does:
Gives you an at‑a‑glance on‑time ship rate, a blended ODR estimate (from late shipments, cancellations, defects), and a projection with workflow automation (e.g., hold‑aware batching, rules‑based carriers, instant tracking). You can tune the weights for late/cancel/defect to mirror your internal KPI mix.
On‑Time Ship & ODR Risk ForecasterEstimate your on‑time ship rate and a blended ODR score. See how automation (faster minutes/order) changes the picture.
Tune how much each component contributes to your blended ODR.On‑time ship rate (baseline)
—
= 100% − late shipmentsBlended ODR (baseline)
—
—Blended ODR (with automation)
—
—On‑time ship rate (with automation)
—
Late % scaled down by faster minutes/orderOrders to fix to hit target
—
—Hours saved / month
—
= orders × (manual − automated) ÷ 60Tip: Adjust weights to mirror your KPI mix.
How to read it
- On‑time rate (OTSR) and ODR (baseline) vs ODR (with automation)
- Risk labels (On‑target / At‑risk / High‑risk) against your target ODR
- Orders to fix: the quickest path (late, cancel, or defect) to hit your target
- Hours saved/month from faster per‑order handling
2) Returns Cost Calculator
What it does:
Breaks down your cost per return and monthly burden, then models the impact of automation (cheaper labels, smarter routing, faster restocks, and better recovery). See savings, ROI vs your subscription, and payback days.
Returns Cost CalculatorEstimate your cost per return and monthly burden, then model savings and ROI from automating labels, routing, and restocking.
Uncheck if customers pay their own return shipping.Automation impact (adjust assumptions)Returns per month
—
= orders × return rateBaseline cost / return
—
Includes shipping (if merchant pays), restocking, processing − recoveryAutomated cost / return
—
Applies savings and recovery upliftBaseline monthly total
—
Automated monthly total
—
Savings / month
—
—ROI vs subscription
—
—
How to read it
- Baseline vs Automated: per‑return cost and monthly total
- Savings/month, ROI, payback
- Top levers ranked (shipping, restocking, processing, or recovery)
Notes & assumptions
- These are directional planning tools—adjust defaults to your reality.
- ODR here is a blended score using weights you control (it’s not an official program metric).
- Returns model focuses on ops costs; it doesn’t include product margin or platform‑specific incentives.
What to do next
- If you’re near your ODR target, tighten your late‑shipment drivers (batch labels at hold‑expiry, better cut‑off rules).
- If returns hurt margin, attack the biggest lever (e.g., return‑label rates or restocking time) first—those typically move fastest.


