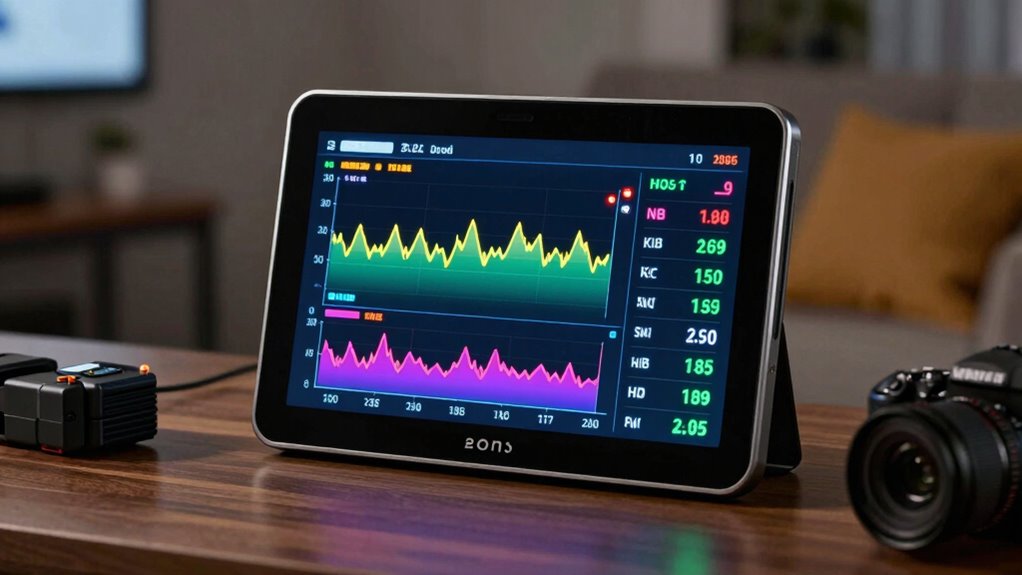

To avoid chasing ghosts with your energy data, focus on understanding patterns and real issues. Look for consistent spikes and trends that align with specific appliances or times of day, and ignore occasional anomalies. Use real-time insights to identify high energy use or malfunctioning devices, and track progress over time to set achievable goals. By staying focused on these key indicators, you’ll make smarter decisions and improve your home’s efficiency—keep exploring to learn more about optimizing your energy use.

Get audio and creator gear delivered free with Prime
- Fast, free delivery on millions of items
- Prime Video, Amazon Music and more included
- Member-only deals all year
Key Takeaways
- Focus on real-time data trends rather than isolated spikes to identify genuine issues.
- Correlate energy spikes with specific appliances or activities for accurate diagnosis.
- Use pattern analysis to distinguish between normal fluctuations and unexplained energy drains.
- Regularly review long-term data to verify consistent problems versus one-time anomalies.
- Set clear energy goals and track progress to avoid chasing minor or insignificant fluctuations.
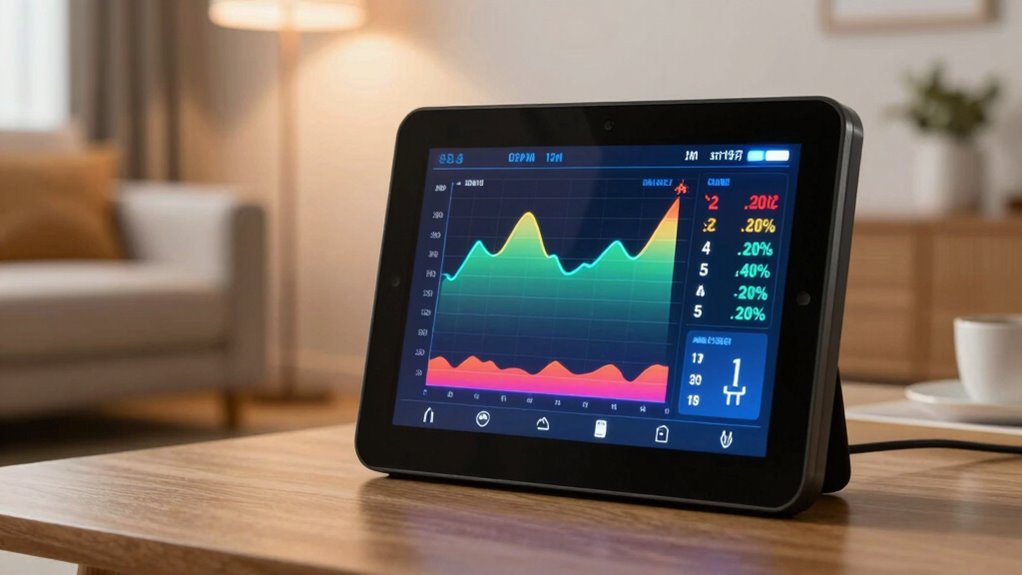
Understanding your home energy monitoring data is key to managing your energy use effectively. When you know how much energy your appliances consume and when, you can make smarter decisions that save money and reduce your carbon footprint. One important aspect to pay attention to is how your data reflects renewable integration. If you’ve invested in solar panels or wind turbines, your monitoring system will show how much clean energy you’re generating versus how much you’re drawing from the grid. This helps you optimize your renewable sources and understand their impact on your overall energy bill. Seeing the real-time contributions of renewable energy can motivate you to adjust usage patterns, like running high-energy appliances during peak solar production, maximizing your clean energy use and minimizing reliance on fossil fuels.
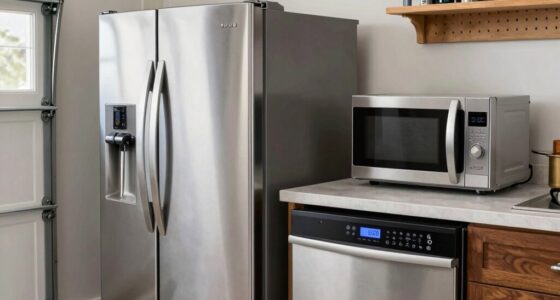
Another critical element is appliance efficiency. Your energy monitoring system breaks down usage by device, revealing which appliances are the biggest energy hogs. If your fridge runs constantly or your HVAC system consumes more than expected, these insights give you the chance to upgrade to more efficient models or adjust their operation. Understanding how different appliances contribute to your total energy consumption allows you to target specific areas for improvement. For example, replacing older appliances with ENERGY STAR-rated models can significantly cut down your energy use over time, making your home more sustainable and cost-effective. Additionally, recognizing appliance efficiency helps you prioritize upgrades that provide the greatest return on investment. Monitoring your energy data over time can also help you identify phantom energy drains that continue to consume power even when appliances are turned off, preventing unnecessary waste. Regularly reviewing this data enhances your ability to detect subtle inefficiencies and optimize your home’s performance.
Furthermore, your energy data can reveal patterns that inform your overall home management. Recognizing energy use patterns enables you to shift consumption to more favorable times, further enhancing your renewable energy utilization. Reading your data isn’t just about identifying high consumption; it’s about understanding patterns. Notice when your energy use spikes—perhaps during certain times of the day or with specific appliances—and adjust your habits accordingly. If your monitoring system shows that your dishwasher or laundry machines operate during peak solar hours, you’re making the most of your renewable investments. Conversely, if you see unexpected energy spikes when no one’s home, it might indicate a malfunction or inefficient device. Addressing these issues helps you avoid chasing ghosts—phantom energy drains that can inflate your bills without obvious reasons.
Finally, consistent review of your home energy data empowers you to set realistic goals. Whether it’s reducing overall consumption, increasing renewable integration, or improving appliance efficiency, data gives you the feedback you need to track progress. It’s not just about reacting to numbers; it’s about understanding the story they tell about your home’s energy habits. Being aware of microplastics in dust and other indoor pollutants can also influence your energy and air quality choices, encouraging you to improve ventilation and filtration. By analyzing trends over time, you can also identify opportunities to further optimize energy savings and enhance your home’s sustainability. By staying engaged and informed, you turn abstract data into actionable steps, ensuring you’re not chasing ghosts but making meaningful improvements to your home’s energy footprint.
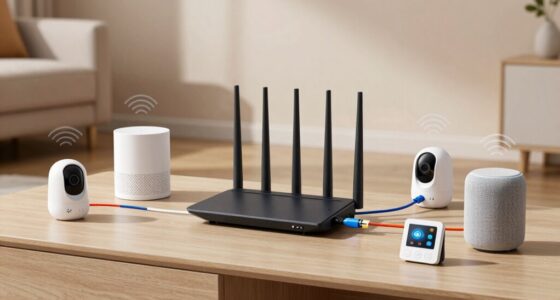
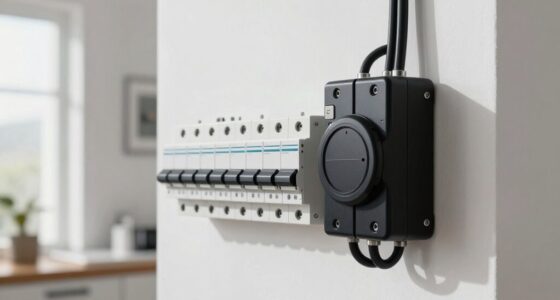
home energy monitor with real-time data
As an affiliate, we earn on qualifying purchases.
As an affiliate, we earn on qualifying purchases.
Frequently Asked Questions
How Often Should I Check My Energy Monitoring Data?
You should check your energy monitoring data at least once a week to track battery efficiency and appliance impact. Regular checks help you spot unusual energy use or efficiency drops early. If you notice significant changes, increase monitoring frequency. Consistent review allows you to optimize your system, save energy, and make sure appliances are running efficiently without chasing ghosts of hidden energy waste.
Can Monitoring Data Predict Future Energy Costs?
Yes, your monitoring data can help with energy cost forecasting and consumption prediction. By analyzing patterns over time, you can identify when energy use spikes and anticipate future costs. Real-time data allows you to adjust habits proactively, potentially saving money. Keep track of seasonal changes and appliance usage, as these insights improve the accuracy of your predictions, helping you budget better and optimize your energy efficiency.
What Is the Most Common Mistake When Reading Data?
The most common mistake is misinterpreting the data due to a lack of understanding of data accuracy. You might overlook sensor calibration issues or ignore fluctuations that are normal, leading to incorrect conclusions. To avoid this, you should verify sensor readings regularly and consider the context of the data. Accurate interpretation requires awareness of potential inaccuracies and a clear grasp of what the data genuinely reflects about your energy use.
How Do I Compare Data Over Different Months?
Think of comparing monthly data like tracking your garden’s growth through seasons. You’ll notice seasonal variations in energy use, so compare similar months year-over-year. For example, if your heating spikes in winter, account for appliance impact during colder months. Always normalize data by weather or temperature, and review long-term trends instead of isolated peaks. This approach helps you see true changes in your energy habits, beyond just seasonal fluctuations.
What Tools Are Best for Analyzing Energy Trends?
You should use tools that focus on data visualization to analyze energy trends effectively. Platforms like Google Data Studio, Tableau, or Excel with chart features help you spot patterns in your energy consumption over time. These tools make it easy to compare data across months, identify peaks, and understand your home’s energy habits visually. By transforming raw data into clear visuals, you gain better insights and can make smarter energy-saving decisions.
Conclusion
Think of your home energy data as a map guiding you through a hidden forest. By understanding the signals, you can spot the sneaky leaks and phantom loads lurking in the shadows. With each insight, you’re clearing a path toward a more efficient home, turning confusing readings into a lighthouse guiding your savings. Embrace this journey, and soon, you’ll be steering your energy landscape with confidence, illuminating the way to a smarter, greener home.
Fall Picks
fall essentials
As an affiliate, we earn on qualifying purchases.